

SERA
Capital Intelligence
Who's raising
Who's deploying
Every week
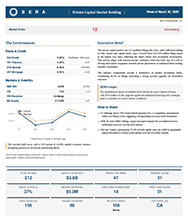
Every week, billions in private capital changes hands. Most of the market finds out too late
Thousands of Regulation D filings hit the SEC every month. But filings alone only tell you who is raising. They don't tell you who is deploying, how fast deals are moving, or which advisers are behind the capital. That requires connecting multiple regulatory databases, layering in macroeconomic signals, and analyzing the result.

We built SERA because we had the same problem
We built SERA to support our own capital deployment. We needed to see both sides of the private capital market: who is raising and who is behind the funds deploying it.
SERA connects SEC Form D filings to Form ADV registered adviser data cross-referencing against 1.6 million fund vehicle records, layers in macroeconomic context from the Federal Reserve, Treasury markets, and volatility indicators, and scores every filing with proprietary AI capital assessments.
One source of truth. 27,679 SEC-registered advisers, filtered to 557 verified outside allocators and tracked weekly across the full Form D pipeline
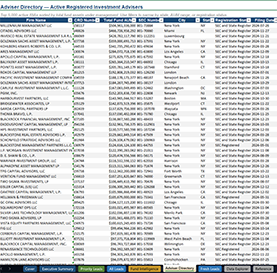
Verified outside allocator universe. 557 SEC-registered advisers filtered from 27,679 total, classified by deployment posture (External, Hybrid, Internal Capital), refreshed weekly.
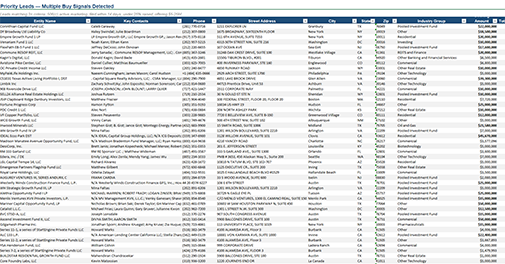
Buyer-aware fit scoring. Allocators ranked weekly for your sector and check size, with decision-maker contact and posture intelligence per row.
Adviser cross-reference. Form D filings matched to registered advisers across 1.6 million fund vehicle records, with classification, AUM, and outside-allocation pattern per firm.
Macro context. Fed rates, yield curve, FedWatch, and VIX structure connected to private capital deployment conditions.
Excel file. Every Monday. Yours permanently
No platform. No login. No download limits. Every report you receive is YOURS TO KEEP.
You own every report permanently. Build your own archive. No platform dependency. If you cancel, your reports stay with you.
Built by a team with 25+ years and $2.8B+ in closed transactions across private equity
SERA Investor Intelligence starts at $199 per month, or $97 for a single report. No contract. Cancel anytime.
| Core | Pro | Institutional | |
|---|---|---|---|
| Best for | Sponsors who need the addressable allocator universe with primary contact per firm. | Sponsors who want fund-level detail and multiple decision-makers per firm. | Sponsors running active outreach who need full market intelligence and deal-fit context. |
| Addressable allocator universe | |||
| Verified outside allocators (refreshed weekly) | ✓ | ✓ | ✓ |
| Allocator classification (External / Hybrid / Internal Capital filter) | ✓ | ✓ | ✓ |
| AUM, registration ID (CRD), and SEC profile link | ✓ | ✓ | ✓ |
| Sectors deployed into and fund types managed | ✓ | ✓ | ✓ |
| Check size ranges and deployment patterns | ✓ | ✓ | ✓ |
| Why Today context per row (recent deployment activity) | ✓ | ✓ | ✓ |
| Outreach Context per row (decision-maker, posture, differentiation) | ✓ | ✓ | ✓ |
| Workflow and outreach | |||
| Top 30 allocators ranked weekly by your sector and check size | ✓ | ✓ | ✓ |
| Status tracking (Contacted, Meeting, Committed, Passed) | ✓ | ✓ | ✓ |
| Named decision-maker (CCO, CIO, CEO, Managing Partner, etc.) | ✓ | ✓ | ✓ |
| Additional named contacts per firm (CFO, COO, Partners) | — | ✓ | ✓ |
| Phone, address, and verified company website | ✓ | ✓ | ✓ |
| Deeper allocator context | |||
| Capital flow patterns and velocity trends | — | ✓ | ✓ |
| Co-investment activity and outside deal share | — | ✓ | ✓ |
| Individual fund records (AUM, minimums, owner count) | — | ✓ | ✓ |
| Fund exemption classification (3(c)(1) vs 3(c)(7)) | — | ✓ | ✓ |
| Recent raise history and fund formation timeline | — | ✓ | ✓ |
| Market intelligence | |||
| Filing volume trends and capital momentum | — | — | ✓ |
| Industry concentration analysis | — | — | ✓ |
| Sector rotation and outlier movement | — | — | ✓ |
| Competitive landscape | |||
| All active capital raises with contact data | ✓ | ✓ | ✓ |
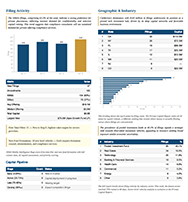
| Offering size, percent raised, days in market | ✓ | ✓ | ✓ |
| Raise benchmarks by industry, size, and state | ✓ | ✓ | ✓ |
| Analysis and delivery | |||
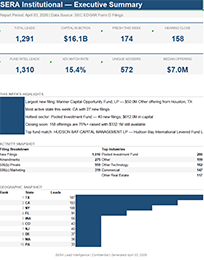
| Executive Summary with universe-movement framing | ✓ | ✓ | ✓ |
| Macro dashboard (Fed, Treasury, VIX, FedWatch) | ✓ | ✓ | ✓ |
| Excel format, yours permanently | ✓ | ✓ | ✓ |
| Subscriber watermark (confidential copy) | ✓ | ✓ | ✓ |
SERA is a data intelligence product published by BEO Investments LLC. It aggregates publicly available regulatory filing data and presents it for informational and research purposes only. SERA is not investment advice, does not evaluate the merits of any offering or issuer, and is not a regulated advisory service. Data is derived from government sources believed to be reliable but not independently verified. For complete terms, data source disclosures, limitations of liability, and intellectual property notices, see beovest.com/disclosures
